4.13. GUI Interaction
4.13.1. Loading the GUI
Initializing the GUI
First, we need to import the TraceGUI into the current namespace:
from optrace.gui.trace_gui import TraceGUI
Create an example geometry as follows:
RT = ot.Raytracer(outline=[-10, 10, -10, 10, -10, 60])

disc = ot.CircularSurface(r=3)
RS = ot.RaySource(disc, pos=[0, 0, -5])
RT.add(RS)

eye = ot.presets.geometry.legrand_eye()
RT.add(eye)
To create a TraceGUI, we need to pass the Raytracer as an argument:
sim = TraceGUI(RT)
Running the GUI
Run the GUI using:
sim.run()
This displays the main window and also raytraces the geometry if it hasn’t already been traced.
Note that TraceGUI.run is a blocking operation.
Parameters
When creating the GUI, additional properties can be assigned. To set the scene to high contrast mode and increase the amount of rays, we can call:
sim = TraceGUI(RT, high_contrast=True, ray_count=2000000)
Available properties are discussed in Section 4.13.3.
Initial Camera View
The initial_camera parameter sets an initial camera view.
sim = TraceGUI(RT, high_contrast=True, ray_count=2000000,
               initial_camera=dict(center=[-50, -50, 0],
               direction=[-1, -1, -1], height=150, roll=-120))
These properties are directly passed to the TraceGUI.set_camera function.
You can read more about the camera settings in Section 4.14.4.
4.13.2. UI Overview
4.13.2.1. Full UI

4.13.2.2. Scene
Overview
An overview of the mouse navigation and keyboard shortcuts is provided below.
Shortcut |
Function |
|---|---|
Mouse drag |
Rotate the camera view |
Mouse wheel |
Zoom in or out |
Shift + Mouse drag |
Move the camera view |
Ctrl + Mouse drag |
Rotate the camera view around the center of the scene window |
Keys |
Zoom in or out |
Arrow keys |
Move the camera view |
Shift + arrow keys |
Rotate the camera view around the left-right or top-bottom axis of the scene |
Key |
Sets the scene view to default view set by GUI parameter |
Key |
Maximize scene (hides the sidebar) |
Key |
Toggle minimalistic view option |
Key |
Toggle high contrast mode |
Key |
Toggle label visibility |
Key |
Render detector image with the current settings |
Key |
Close all open pyplot plots |
Key |
Randomly re-choose the plotted rays |
There are orientation axes in the bottom left of the scene that display the directions of the cartesian axes in the 3D view. The labels on the handles are clickable and set the camera to the corresponding view.
When an action/tasks is running, you are informed by a status text in the bottom right of the scene.
Picking and Clicking
After clicking a ray intersection on a surface, a list of properties on the selected ray section is displayed.
The intersection position is also marked with a red crosshair, while the picked ray is highlighted in red.
Even more properties are shown when using Shift + Click.
Right-clicking inside the scene displays the coordinates of the picked position.
Shift + Right Click moves the currently selected detector to the picked z-position.
High Contrast Mode
Activate the high contrast mode to make the background white and show all other elements in grayscale. This is useful when creating scene views for academic output, as the background color in these documents is also white.
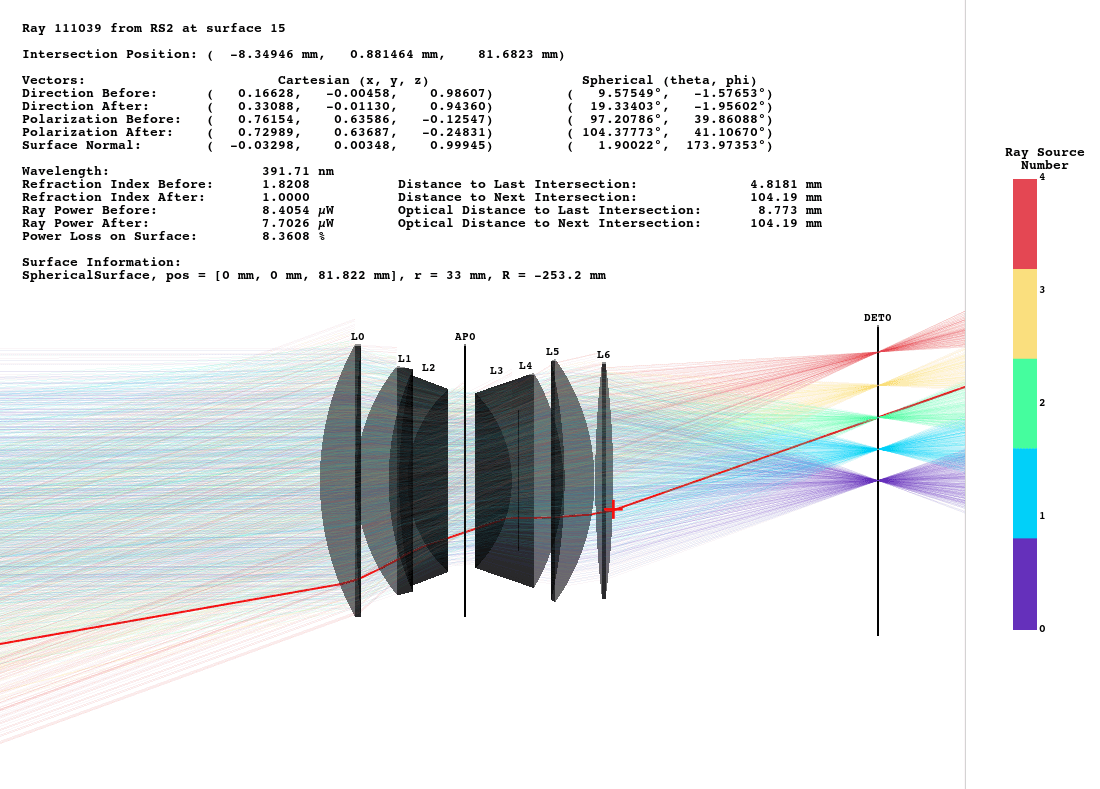
Fig. 4.68 Double Gauss example with high_contrast-mode enabled.
4.13.2.3. Sidebar
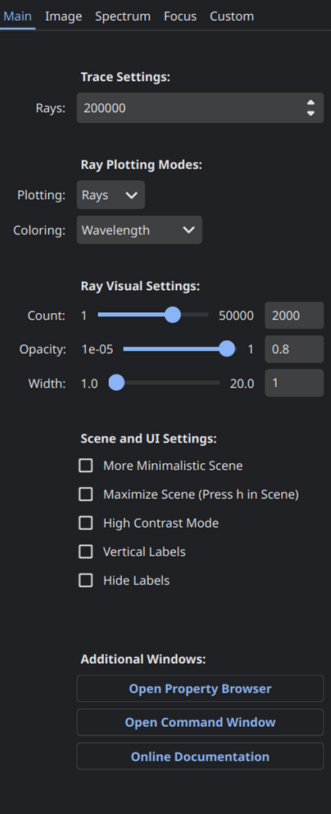
The sidebar is positioned at the right side of the scene and consists of multiple tabs:
Main Tab |
Includes settings for raytracing, scene visualization and buttons for opening additional windows |
|---|---|
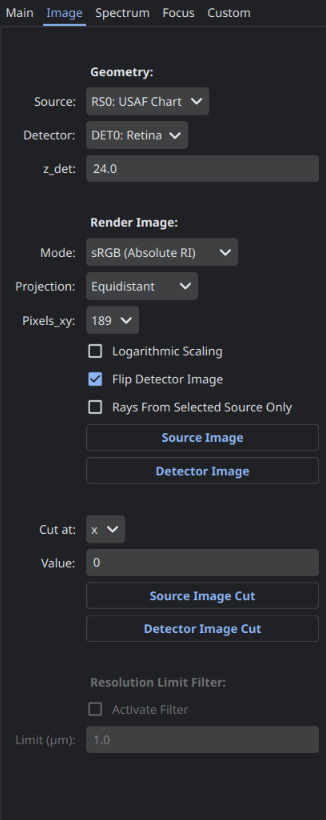
Image Tab |
Features options for rendering source and detector images |
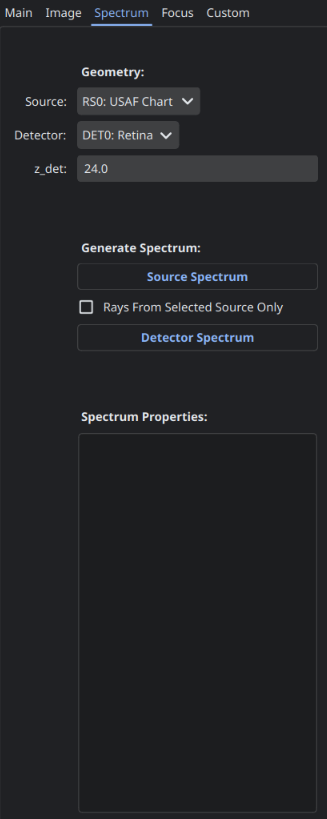
Spectrum Tab |
Settings for the rendering of source or detector light spectrum histograms |
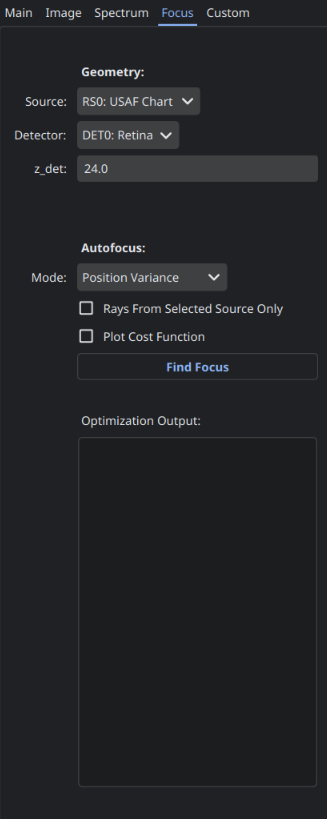
Focus Tab |
Focus search settings and results |
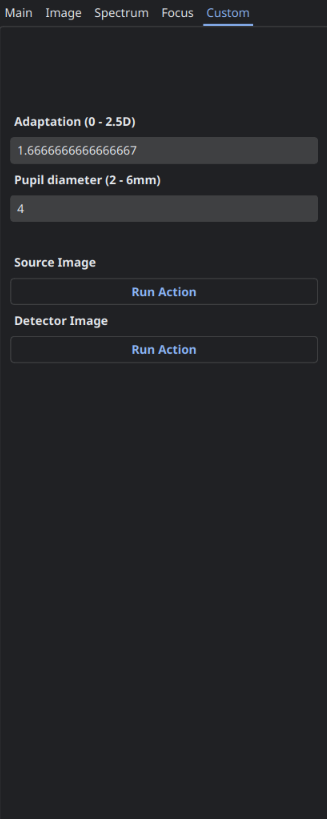
Custom Tab |
Custom UI elements be created before running the GUI |
|
|
|
|
|
4.13.2.4. Additional Windows
There are additional windows in the interface besides the main window. These will be discussed in Section 4.13.4, but a quick overview is provided here:
Window |
Access |
Function |
|---|---|---|
Command Window |
Button in the main tab of the sidebar |
Command execution and history for controlling the GUI and raytracer |
Property Browser |
Button in the main tab of the sidebar |
Overview of raytracer, scene and ray properties as well as cardinal points |
4.13.4. Additional Windows
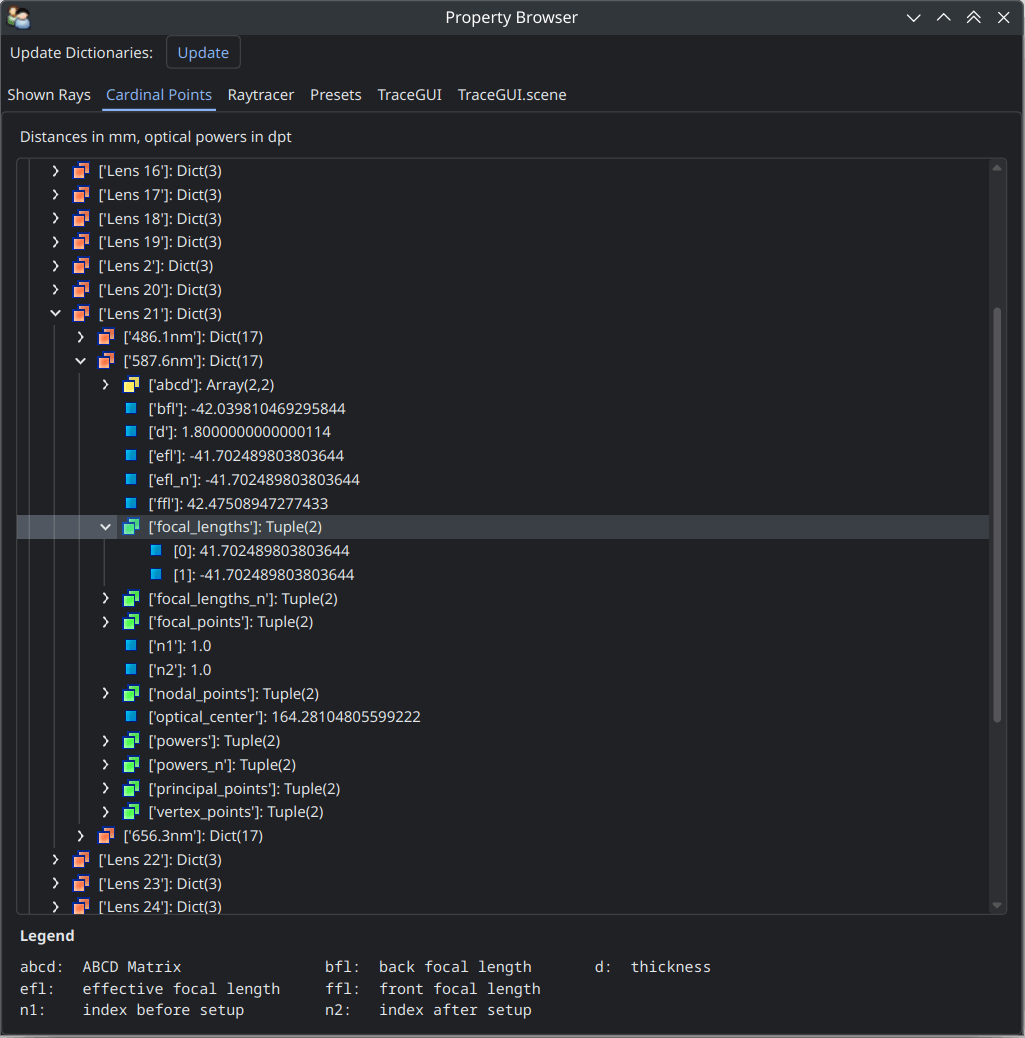
4.13.4.1. Property Viewer
The property viewer provides an interactive tree view of:
properties about the rays/points currently shown
cardinal points and other paraxial properties of the lenses and the whole lens setup
properties of the
Raytracerclassavailable presets
TraceGUIpropertiesTraceGUIscene propertiesTraceGUIscene actor properties
All displayed property values are read-only snapshots.
To update the values, click on the Update button.
Navigate the tabs to switch to different trees.
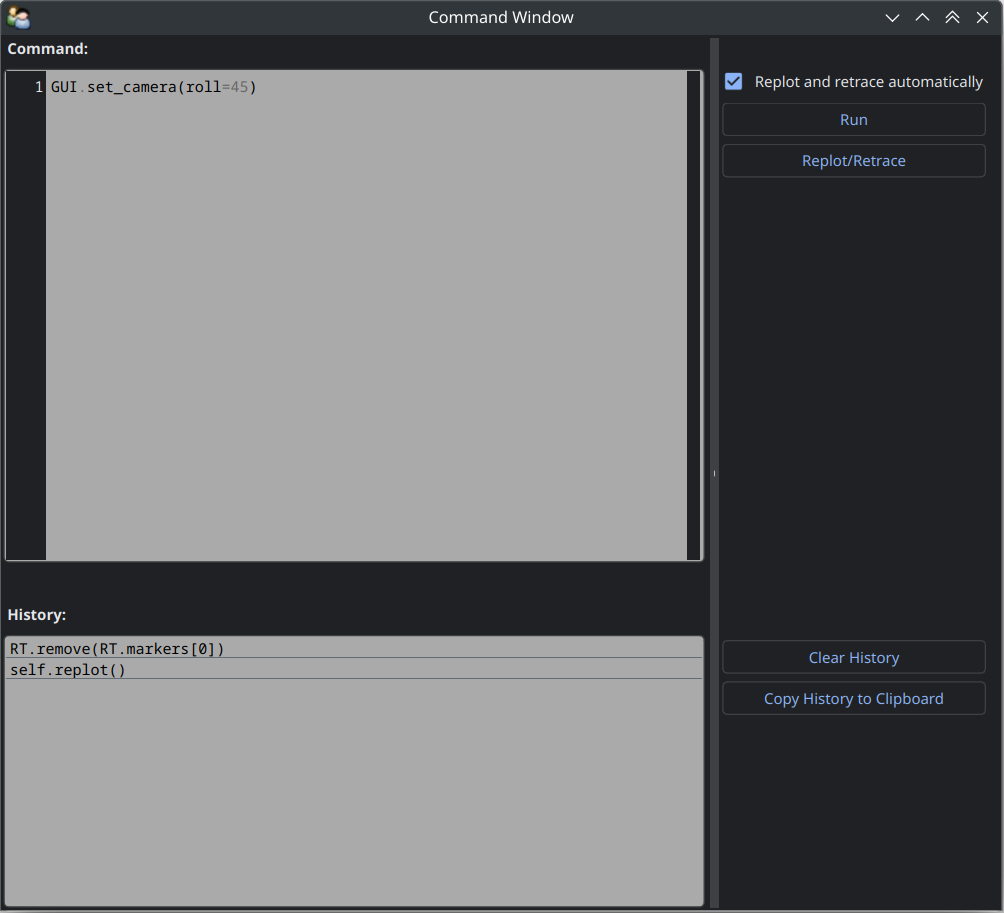
4.13.4.2. Command Window
Inside this window, commands can be defined and executed from inside the scope of the TraceGUI class.
This allows for the scripting on the GUI and Raytracer at runtime, including adding, changing or removing geometries.
After entering a command in the upper text field, the Run-button needs to be pressed.
Note that the command is only run, if the GUI is idle and not doing any other tasks.
After running the command, the scene is automatically updated and the geometry is retraced if the option
“Retrace and replot automatically” is set.
This can also be done manually with the Replot/Retrace Button.
The command is added to the history list in the lower part of the window.
Copy each history field with Ctrl+C or export the whole history by pressing Copy History to Clipboard.
There is also a Clear button available that empties the entire history.
All actions are run sequential to avoid race conditions and issues with scene rendering. This leads to the UI being unresponsive while running the command.
There are multiple object aliases to simplify coding inside the command window:
Alias |
Reference |
|---|---|
|
the TraceGUI object (same as |
|
the pyvista scene |
|
the camera of the pyvista scene |
|
the raytracer used |
|
the lens list of the raytracer |
|
the aperture list of the raytracer |
|
the filter list of the raytracer |
|
the ray source list of the raytracer |
|
the detector list of the raytracer |
|
the marker list of the raytracer |
|
the volume list of the raytracer |
For instance, you can write RT.remove(AL[1]) to remove the second aperture of tracing geometry.
By default, you also have access to most optrace classes, e.g. Raytracer, RGBImage, Group, RingSurface, ....
To include custom objects in the class, you can simply pass them to the constructor:
var = 78.2353

def func():
    ...

sim = TraceGUI(RT, important_function=func, important_variable=var)
This also makes them available for usage inside the command window as
GUI.important_function(), GUI.important_variable, ....