4.1. Overview
4.1.1. Structure
Topic |
Descriptions |
Classes/Functions |
Links |
|---|---|---|---|
Paraxial Analysis |
Calculating principal planes, focal points, object and image distances, exit and entrance pupil |
||
Paraxial Imaging |
Image simulation through convolution with a rendered point spread function |
||
General Geometrical Optics and Image/Spectrum Simulation |
Sequential Monte-Carlo Raytracing of optical setups. Analysis of ray paths, simulation of detector images and spectra, focus search. |
|
Raytracer, Image Classes, Spectrum Classes, Focus Search, Accessing Ray Properties |
Image, Surface, Spectrum and Refractive Index Plotting |
Display images, spectra, surfaces and refractive indices graphically in 2D plots. |
||
Image color conversion |
Convert or access image colors |
||
Graphical Setup and Visualization |
Graphical display of the 3D tracing scene and traced rays. Additional control features for the simulation. |
4.1.2. Namespaces
optrace is the primary namespace.
All functionality from optrace.tracer is automatically included in this main namespace.
import optrace as ot
Access classes using ot.Raytracer, ot.CircularSurface, ot.RaySource, ....
optrace provides plotting functionality for images, spectra, surfaces and media.
These plotting functions are included in the optrace.plots namespace.
import optrace.plots as otp
The GUI is included in the namespace optrace.gui.
For the user, only the TraceGUI class is relevant there, so it can be directly imported in the main namespace:
from optrace.gui import TraceGUI
4.1.3. Global Options
Global options are set through the attributes of the class optrace.global_options.
4.1.3.1. Progressbar
A progress bar displays the completion status in your terminal during calculation-intensive tasks:
Rendering: 40% |############4 | 8/20 [00:17<00:22]
It can be deactivated using:
ot.global_options.show_progressbar = False
There is also a context manager available for turning it off temporarily only:
with ot.global_options.no_progress_bar():
    do_something()
4.1.3.2. Warnings
optrace outputs warnings of type OptraceWarning,
which are a custom subclass of UserWarning. They can be filtered using the warnings python module.
A simple way to silence them, for instance when doing many automated tasks, is by assigning:
ot.global_options.show_warnings = False
There is also a context manager available for turning them off temporarily:
with ot.global_options.no_warnings():
    do_something()
4.1.3.3. Multithreading
By default, multithreading parallelizes tasks like raytracing, focus search and image rendering. However, it can be undesired in some cases, especially when debugging or running multiple raytracers in parallel. Multithreading can be turned off with:
ot.global_options.multi_threading = False
A specific number of cores/threads can be set with the approach in Section Section 4.1.4.
4.1.3.4. Wavelength Range
optrace is optimized for operation in the visible wavelength range of 380 - 780 nm. However, the range can be extended by setting new bounds:
ot.global_options.wavelength_range = [300, 800]
Note that most presets like refractive indices are not defined for regions outside the default range. This can lead to issues when using these presets.
4.1.3.5. Spectral Colormap
Spectral plots (spectrum, refractive index, ray coloring) use a spectral colormap that maps wavelength values to their corresponding colors. This leads to a rainbow-like mapping for the visible range.
The default spectral mapping is inappropriate for working in the infrared or ultraviolet region. A custom mapping for better value differentiation is supplied by:
import matplotlib.pyplot as plt

ot.global_options.spectral_colormap = lambda wl: plt.cm.viridis((wl-300)/800)
In this example the colormap is set to the viridis colormap from pyplot, where 300 is mapped to the lowest value of 0 and 800 to the highest value of 1. The specified function should take a wavelength numpy array (of some length N) as argument and return a two dimensional array with RGBA values between 0-1 and shape (N, 4).
The colormap can be reset to its default by setting it to None.
4.1.3.6. UI Dark Mode
The UI dark mode is enabled by default. To activate the light mode, use:
ot.global_options.ui_dark_mode = False
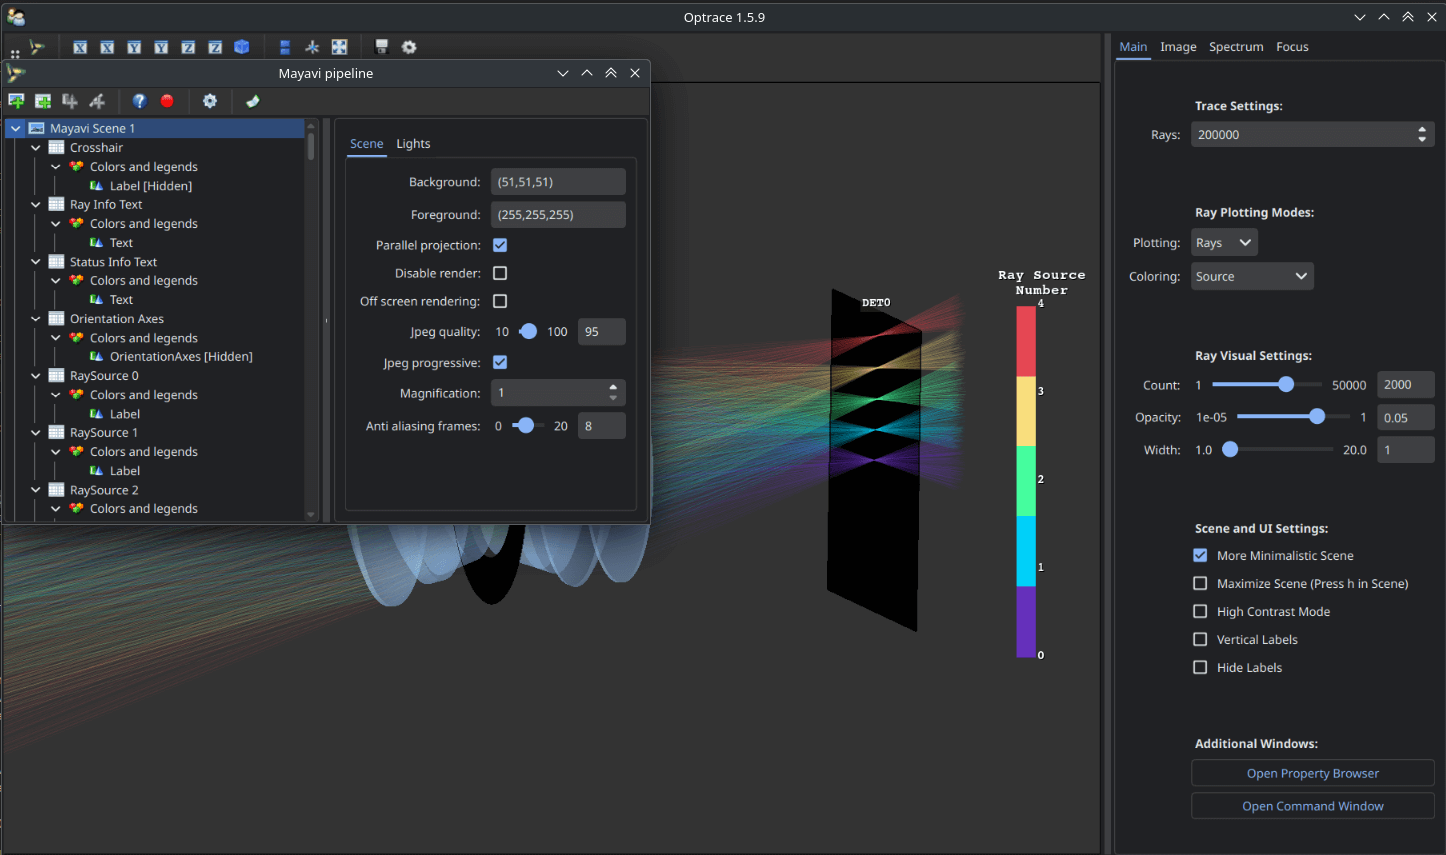
Fig. 4.1 With ui_dark_mode enabled.
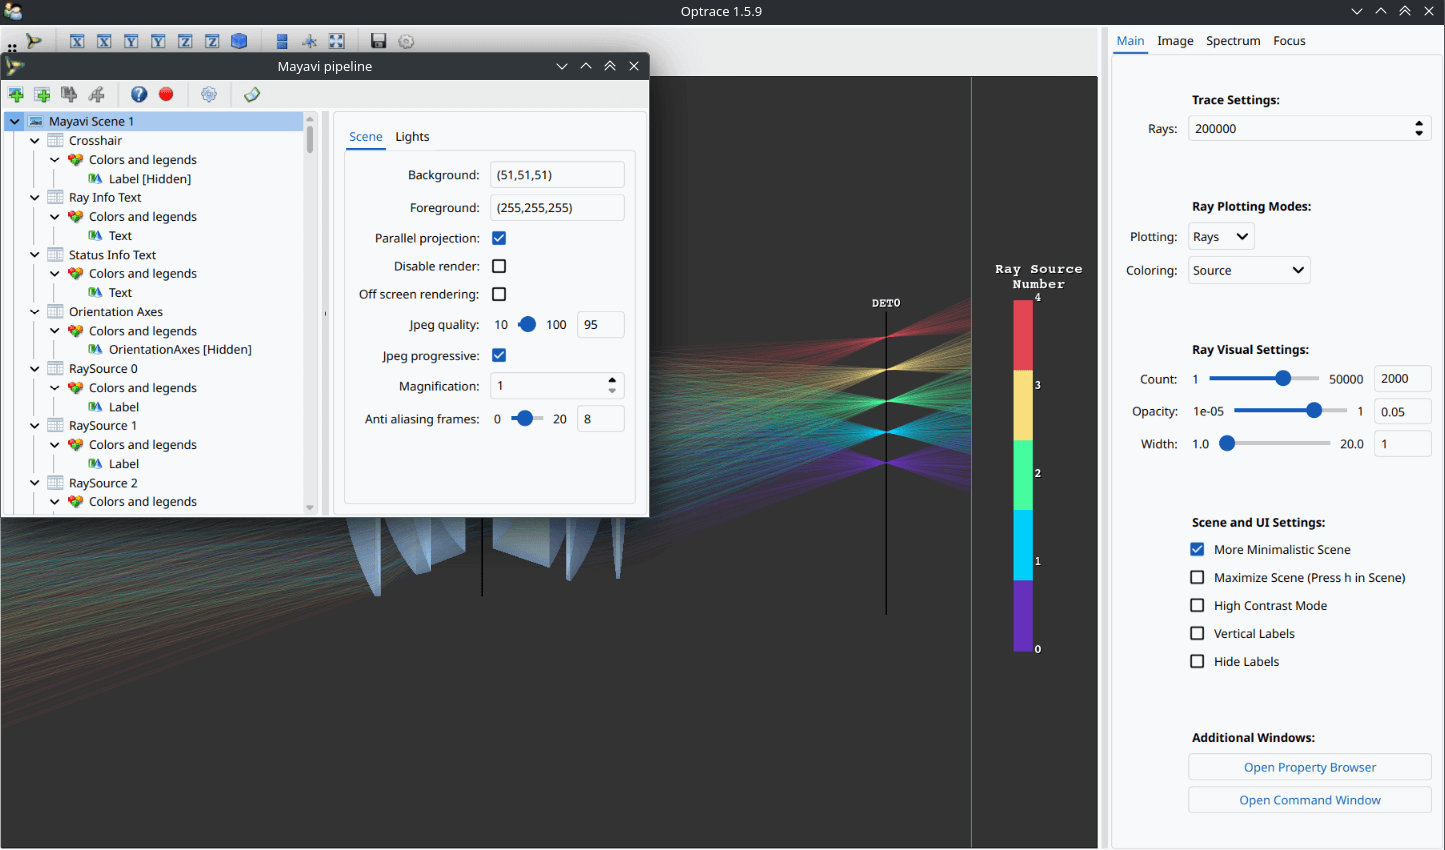
Fig. 4.2 With ui_dark_mode disabled.
Changes are applied to all current GUI windows as well as new ones.
4.1.3.7. Plot Dark Mode
A separate option plot_dark_mode is available for the content of the plotting windows.
To deactivate it, use:
ot.global_options.plot_dark_mode = False
Light mode is especially useful for academic output, where images are shown on a white background.
Note that changes are only applied to new pyplot windows, not already opened ones.


4.1.4. Multithreading with a specific number of cores
optrace supports setting the number of available cores, which corresponds to the maximum number of threads that will be used for the computations. The setting can be either applied as Python argument:
python -Xcpu_count=4 ./script.py
Using an environment variable from the terminal calling python:
export PYTHON_CPU_COUNT=4
Or from within your python script, so it is applied locally only:
import os
os.environ["PYTHON_CPU_COUNT"] = 4

# do computations with 4 threads
...
It is important to note that only some actions use multithreading, and only a few functions work with all available/specified cores. Setting the CPU count only provides an upper limit.
4.1.5. Running optrace on Wayland
Issues persist when running vtk under Wayland on Linux (vtk/issues/18701, pyvistaqt/issues/445). The following error message appears:
X Error of failed request: BadWindow (invalid Window parameter)
Major opcode of failed request: 12 (X_ConfigureWindow)
Resource id in failed request: 0x3
Serial number of failed request: 7
Current serial number in output stream: 8
Before running Python, set the following environment variable, so the X11 windowing system is used instead:
export QT_QPA_PLATFORM=xcb